Product Categories
- Arduino Shields
- Breakout Boards
- CAN (Controller Area Network)
- Connectors and Interconnect
- Drivers, DACs & Outputs
- FIRST Robotics Competition
- Formula SAE
- Hardware
- Interface and Logging
- Power Supplies and Distribution
- Qwiic Connect System
- R3aktor Data Acquisition
- Sensors
- Software
- Switches, Encoders, & Buttons
- Temperature Measurement
- Wire
- Discontinued
Tech Article Categories
Table of Contents
Posted: March 6, 2025
Modified: March 6, 2025
Home > Tech Article Categories > Temperature Measurement > Temperature Logging with R3aktor M0 Core
Temperature Logging with R3aktor M0 Core
Introduction
The onboard SD card, LiPo battery support, and QWIIC connector make the R3aktor M0 Logger ideal for quick and portable data acquisition projects. In this example a SEN-30011 shield is used to monitor the temperature of four thermocouples and then log their values to a SD card.
This example represents a 'from scratch' solution, where you have complete control of the software running on the R3aktor. For a more complete solution, check out R3aktor Core and Control Center. R3aktor Core combines a temperature measurement shield and a M0 Logger into a single product and includes free firmware and PC software!
Hardware Setup
For this project, you will need:
- (x1) R3aktor M0 Logger Board
- (x1) USB-C cable
- (x1) Micro-SD card
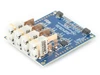
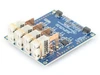
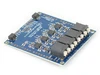
- (x1) SEN-30011: Quad MCP960X Thermocouple
- (x4) K-type thermocouples
- (x1) QWIIC connector cable
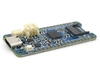
Connect the 4 thermocouples to the SEN-30011 breakout board. Connect the SEN-30011 to the R3aktor board with the qwiic connector cable. Your setup should look like the image below.
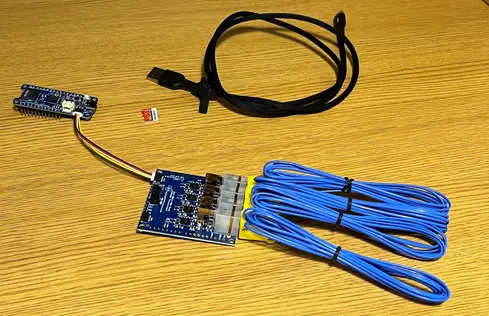
Connect the R3aktor board to your computer with the USB-C cable.
Install Required Libraries
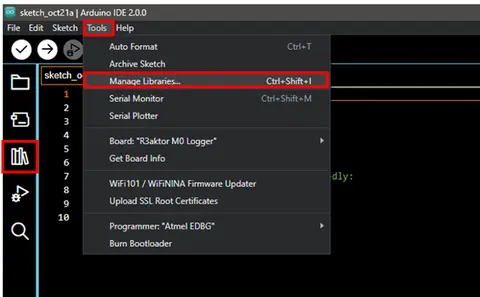
Open the Arduino IDE. For this project, you will need to install the PWFusion MCP906X library. Open the library manager by selecting the library icon on the left or by selecting Tools -> Manage Libraries…
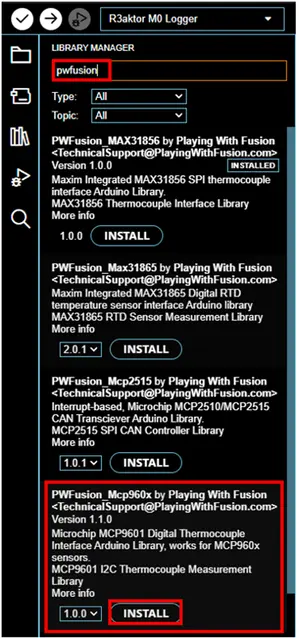
In the library manager panel, type pwfusion in the search box and locate the MCP906X library. Select install and wait for the installation process to complete.
You will also need to install the Arduino SD card interface library. Repeat the above process but instead, type sd in the search box, set the type filter to Arduino, and then locate and install the library called SD by Arduino, SparkFun.
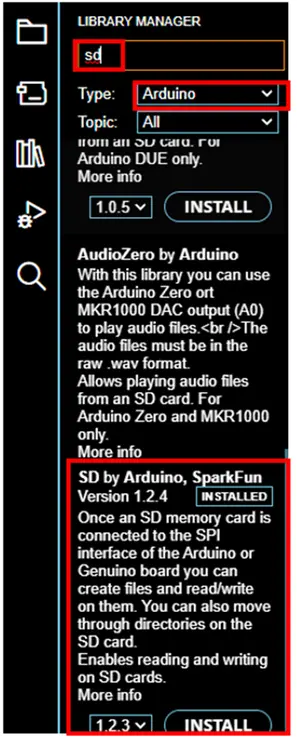
Wait for the installation process to complete.
Write the Software
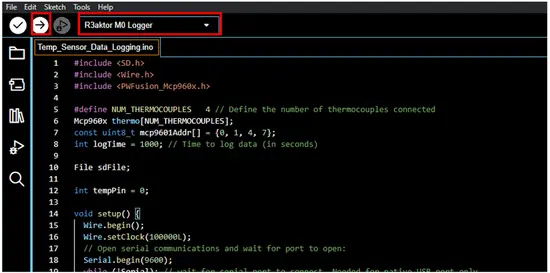
Copy and paste this code into a new Arduino IDE sketch:
- #include <SD.h>
- #include <Wire.h>
- #include <PWFusion_Mcp960x.h>
- #define NUM_THERMOCOUPLES 4 // Define the number of thermocouples connected
- Mcp960x thermo[NUM_THERMOCOUPLES];
- const uint8_t mcp9601Addr[] = {0, 1, 4, 7};
- int logTime = 1000; // Time to log data (in seconds)
- File sdFile;
- int tempPin = 0;
- void setup() {
- Wire.begin();
- Wire.setClock(100000L);
- // Open serial communications and wait for port to open:
- Serial.begin(9600);
- while (!Serial); // wait for serial port to connect. Needed for native USB port only
- // Initialize SD card
- Serial.print("Initializing SD card...");
- if (!SD.begin(SDCARD_SS_PIN)) { // SDCARD_SS_PIN is the defined pin for the SD Card reader
- Serial.println("Initialization failed.");
- while (1);
- }
- Serial.println("Initialization done.");
- // Initialize MCP960X Thermocouple
- for (int i=0; i<NUM_THERMOCOUPLES; i++) {
- thermo[i].begin(mcp9601Addr[i]);
- if (thermo[i].isConnected()) {
- Serial.print(F("Found MCP9601 sensor at address "));
- Serial.println(i);
- thermo[i].setThermocoupleType(TYPE_K);
- thermo[i].setResolution(RES_18BIT, RES_0p0625);
- }
- else {
- Serial.print(F("ERROR: Unable to connect to MCP9601 sensor at address "));
- Serial.println(i);
- }
- }
- SD.remove("temp.csv"); // If the file exists, remove it so the data will be stored in a new file
- sdFile = SD.open("temp.csv", FILE_WRITE);
- if (sdFile) {
- sdFile.println("Temperature");
- sdFile.close();
- } else {
- Serial.println("error opening temp.csv");
- }
- for(int i=0; i < logTime; i++) {
- sdFile = SD.open("temp.csv", FILE_WRITE);
- if (sdFile == true) {
- sdFile.print(i); Serial.print(i);
- for (int j=0; j<NUM_THERMOCOUPLES; j++) { // Loop through each thermocouple
- float value = readThermocouples(j);
- sdFile.print(","); sdFile.print(value); Serial.print(","); Serial.print(value);
- }
- sdFile.println(); Serial.println();
- sdFile.close(); // Each file must be closed before another can be opened
- } else {
- Serial.println("error opening PWF.txt"); // If the file didn't open, print an error
- }
- delay(1000); // Read the thermocuople temp every 1 second
- }
- Serial.println("File closed. Logging complete");
- }
- float readThermocouples(int thermocoupleID) {
- // Function to read the temp
- switch (thermo[thermocoupleID].getStatus()) {
- case READY:
- return thermo[thermocoupleID].getThermocoupleTemp();
- default:
- return -1;
- }
- }
- void loop() {
- }
Before uploading the code, insert the micro-SD card into the R3aktor board’s micro-SD card slot.
Make sure to select the correct board and COM port number and select upload.
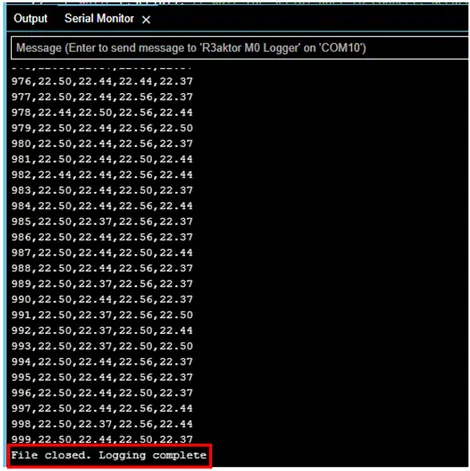
Open the serial monitor by selecting the serial monitor icon in the upper right corner or by selecting Tools -> Serial Monitor
You will see a string of numbers separated by commas. This is exactly how the data from the thermocouples is being recorded in the .csv file.
Wait 1000 seconds for the logging to complete.
A message will appear in the serial monitor when the logging process is complete.
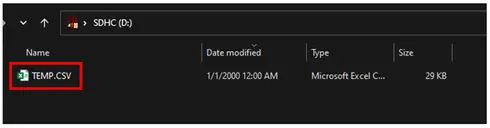
When this happens, remove the micro-SD card form the R3aktor board and insert it into your computer. Navigate to the micro-SD card folder location and open the file named temp.csv in a spreadsheet application like Microsoft Excel.
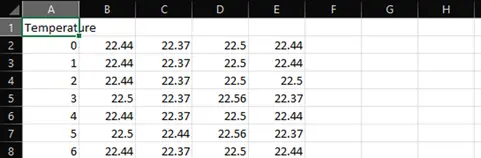
As you can see, the output is almost identical to the output in the serial monitor of the Arduino IDE.
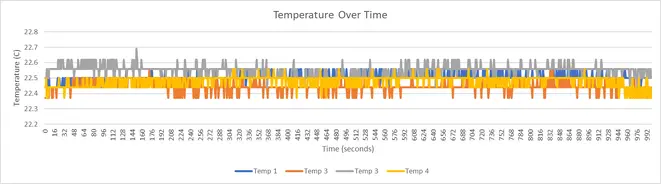
There are many applications for logging data in a .csv format, such as making the utilization of the data much easier. Below is a graph of the data for visualization purposes.
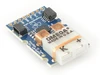 K-Type Thermocouple Digital I2C Interface MCP9601 Breakout
 Universal Thermocouple Digital I2C MCP9601 Breakout (Weidmuller, PUSH IN)
 4-Channel J-Type Thermocouple Digital I2C Interface MCP9601 Breakout
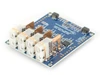
 4-Channel K-Type Thermocouple Digital I2C Interface MCP9601 Breakout
 4-Channel T-Type Thermocouple Digital I2C Interface MCP9601 Breakout
 4-Channel Universal Thermocouple Digital I2C MCP9601 Breakout (PUSH IN)
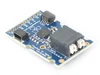
 R3actor M0 Logger with SD Socket and Battery Charger